Football · Preview · Class D1
Wakefield at Homer: Homer looks for its first win
Wakefield (1-7) at Homer (0-8), Friday, Oct. 23. Playoff picture, season stats, charts and history before the Week 9 game.

Game-day information: Kickoff not independently confirmed for this publication. Check the Game Center for current start-time information. This article’s schedules and statistics are dated reporting, not live score updates.
Scores are NSAA finals. Points and ranks are NSAA wildcard standings, checked Oct. 21, 2026. Projections are not official seeds.
Homer (0-8) gets one more chance at a first win Friday, against Wakefield (1-7). Both play in District D1-4: Wakefield is 0-4 in district games and Homer is 0-4.
Friday, Oct. 23, at Homer. Kickoff time has not been posted on our schedule yet.
The playoff picture
In Class D1, the seven district champions and the nine best remaining averages qualify.
Wakefield is 36th in Class D1's NSAA point standings at 33.250. It is 0-4 in District D1-4 games.
Homer is 38th in Class D1's NSAA point standings at 33.000. It is 0-4 in District D1-4 games.
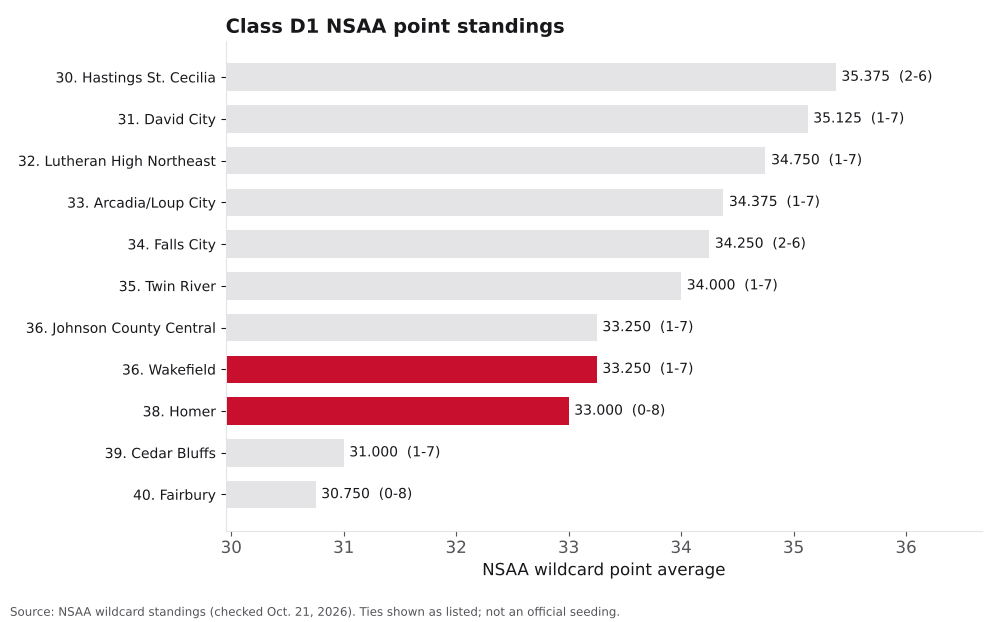
Projections are not official seeds. NSAA sets the field after Week 9.
How they got here
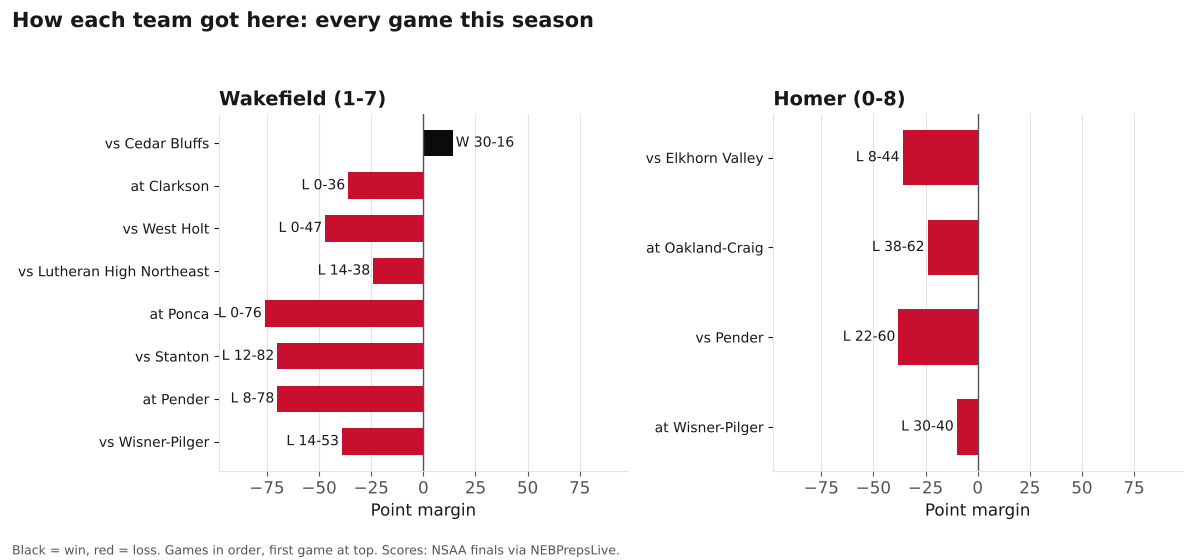
Wakefield is 1-7. Its season began with a 30-16 win over Cedar Bluffs (1-7). Its losses: at Clarkson (4-4), 36-0; West Holt (5-3), 47-0; Lutheran High Northeast (1-7), 38-14; at Ponca (5-3), 76-0; Stanton (8-0), 82-12; at Pender (4-4), 78-8; Wisner-Pilger (7-1), 53-14. Its best win by opponent record was a 30-16 win over Cedar Bluffs (1-7). It comes in on a 7-game losing streak, most recently a 53-14 loss to Wisner-Pilger (7-1).
Homer is 0-8. Its season began with a 44-8 loss to Elkhorn Valley (5-3). It is still looking for its first win. Its closest game was a 40-30 loss at Wisner-Pilger (7-1). Its most recent scored game was a 40-30 loss at Wisner-Pilger (7-1). Its record also includes three games reported as 1-0 (forfeit or administrative result), which are left out of the scoring numbers here.
By the numbers
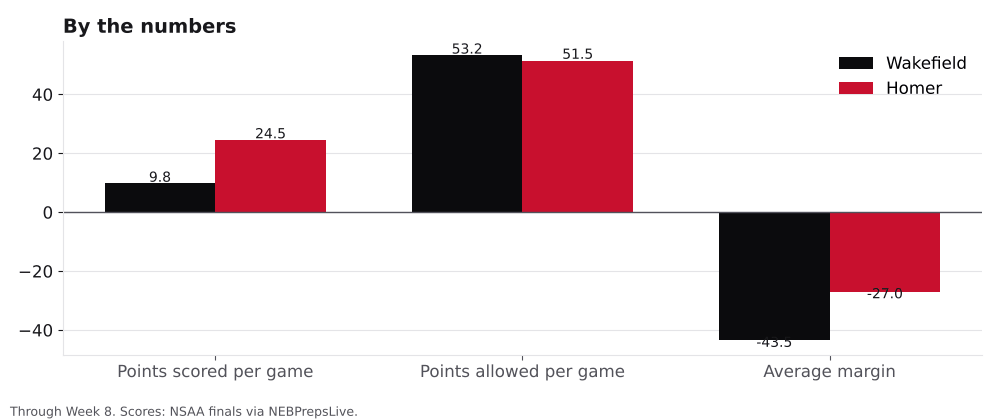
| Wakefield | Homer | |
|---|---|---|
| Record | 1-7 | 0-8 |
| Class and NSAA rank | D1, 36th (33.250) | D1, 38th (33.000) |
| Coaches poll (Oct. 18) | Not ranked | Not ranked |
| Points scored per game | 9.8 | 24.5 |
| Points allowed per game | 53.2 | 51.5 |
| Average margin | -43.5 | -27.0 |
| Current streak | Lost 7 | — |
Shared opponents
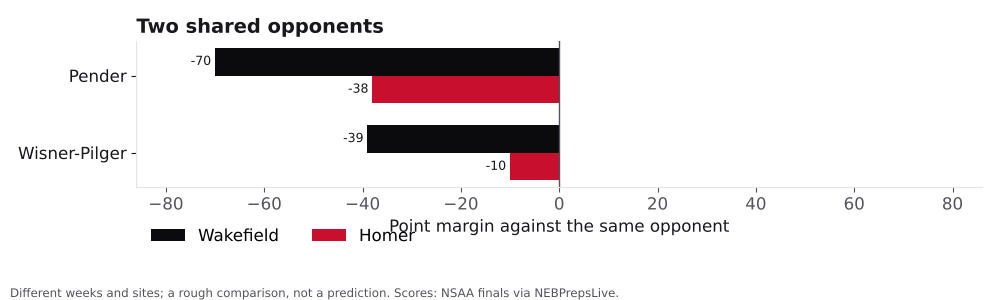
These two have played two of the same teams. It's a rough guide, since the games came in different weeks and places.
| Opponent | Wakefield | Homer |
|---|---|---|
| Pender | L 8-78 | L 22-60 |
| Wisner-Pilger | L 14-53 | L 30-40 |
Editorial update, Oct. 21: Program-history claims from the supplied school-history mapping are withheld pending school-identity verification. This does not change the current-season results, records or statistics above.
What to watch
- Homer's offense. It averages 24.5 points. Wakefield allows 53.2.
- Homer's first win. This is its last regular-season chance.
- Wakefield's streak. 7 straight losses.
Game center: live score, matchup and both teams →
Game Center: Wakefield at Homer →
Wakefield team center → · Homer team center →
Nebraska football scores and schedules → · Football playoff tracker →
Result note: a 1–0 entry is shown as listed by NSAA. It is not treated as evidence of an on-field score or a confirmed forfeit.