
Football · Preview · Class D3
No. 1 Lawrence-Nelson vs. No. 16 St. Mary's: Class D3 first-round breakdown
No. 1 Lawrence-Nelson (9-0) hosts No. 16 St. Mary's (5-4) in the Class D3 first round Fri., Oct. 30. Stats, charts, players to watch, history and keys to the game.

Publication check, Oct. 28: Current NSAA seeds, records and point averages checked; kickoff and host details synchronized with the verified site schedule. Season statistics and chart reporting remain the dated Week9 draft snapshot, not a new full-season audit.
Seeds, records and point averages: NSAA's official bracket, Oct. 24, 2026. Scores: NSAA finals. Player stats: MaxPreps game reports through Week 9. Coaches poll: Hurrdat Sports, Oct. 18.
The Class D3 playoffs start with No. 16 St. Mary's (5-4) traveling to No. 1 Lawrence-Nelson (9-0).
The game is Friday, Oct. 30, at 6:00 PM CT. Host: Lawrence-Nelson. Current Game Center and source links →
The matchup at a glance
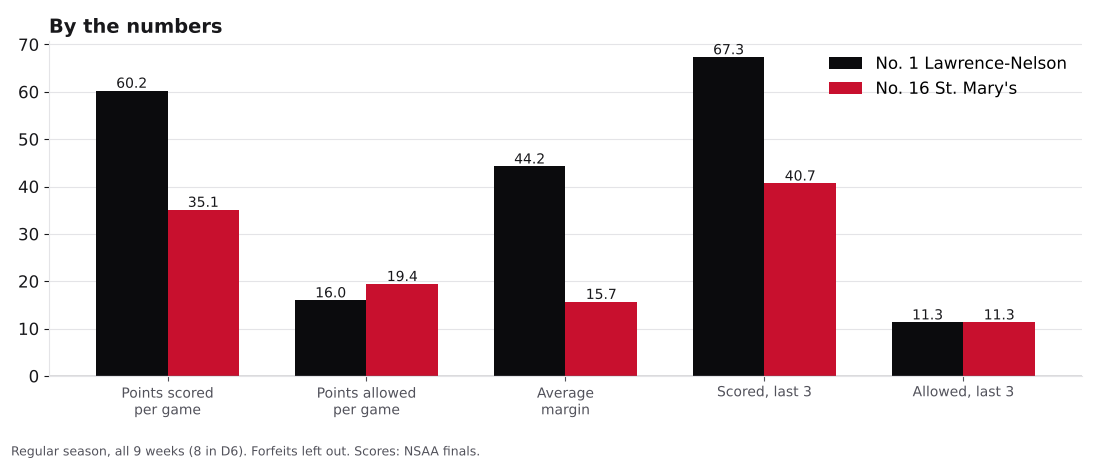
Lawrence-Nelson finished 5.8888 points ahead of St. Mary's in NSAA's point averages. Lawrence-Nelson scored 60.2 and allowed 16.0 points a game; St. Mary's scored 35.1 and allowed 19.4. Lawrence-Nelson's opponents went a combined 40-41, and St. Mary's's went 44-37.
| Lawrence-Nelson | St. Mary's | |
|---|---|---|
| Seed | No. 1 | No. 16 |
| Record (NSAA) | 9-0 | 5-4 |
| NSAA point average | 46.4444 | 40.5556 |
| Coaches poll (Oct. 18) | No. 2 | Receiving votes |
| Points scored / game | 60.2 | 35.1 |
| Points allowed / game | 16.0 | 19.4 |
| Average margin | +44.2 | +15.7 |
| vs. playoff teams | 3-0 | 0-4 |
| vs. winning teams | 5-0 | 1-4 |
| One-score games | — | 0-2 |
| Opponents' combined record | 40-41 | 44-37 |
| Last 3 games | W 70-28, W 72-0, W 60-6 | W 42-14, L 14-20, W 66-0 |
| Streak | Won 8 | Won 1 |
How Lawrence-Nelson got here
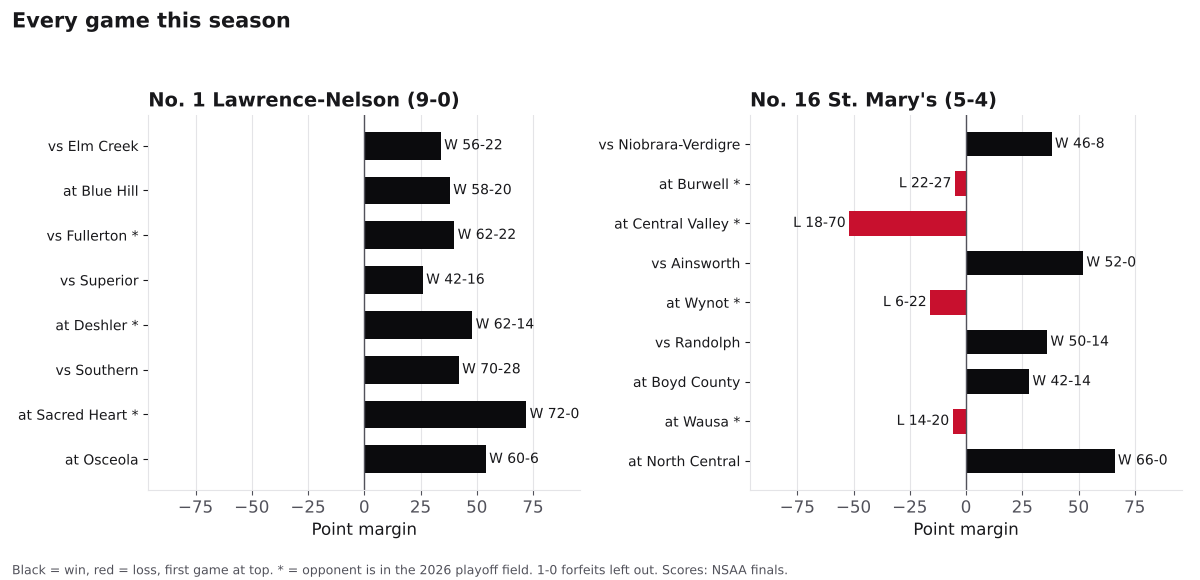
Lawrence-Nelson went through the regular season 9-0 and outscored opponents 482-128. Its closest game was a 42-16 win over Superior (4-5). Its best win by opponent was a 62-14 win at Deshler (7-2), a playoff team. Against teams that made this year's playoff field, it went 3-0. It comes in on an 8-game winning streak, capped by a 60-6 win at Osceola (4-5) in Week 9. Its record also includes one 1-0 result (forfeit), left out of the scoring numbers.
How St. Mary's got here
St. Mary's finished the regular season 5-4, scoring 316 points and allowing 175. All four losses came against teams with winning records: at Burwell (7-2), 27-22; at Central Valley (8-1), 70-18; at Wynot (7-2), 22-6; at Wausa (8-1), 20-14. Its best win by opponent was a 42-14 win at Boyd County (5-4). Against teams that made this year's playoff field, it went 0-4. In Week 9 it had a 66-0 win at North Central (1-8). The defense posted two shutouts.
By the numbers
Players to watch
Season totals from MaxPreps game reports through Week 9. Not every game has a report, so treat these as minimums.
Lawrence-Nelson
- W. Frey (QB): 794 passing yards, 48 of 72, 12 TD, 5 INT; also 831 rushing yards
- K. Peters: 549 rushing yards (9.8 per carry), 13 TD
- J. Hoelting: 22 catches, 355 yards, 3 TD
- C. Heikkinen: 62 tackles, 9 for loss
- C. Wehrman: 3 interceptions
- Wyatt Frey (TE), one of our top 2027 recruits
MaxPreps game reports cover 7 of its 9 games.
St. Mary's
- L. Brabec (QB): 1,372 passing yards, 124 of 218, 16 TD, 10 INT
- K. Couch: 403 rushing yards (6.5 per carry), 5 TD
- B. Barlow: 60 catches, 623 yards, 8 TD
- D. Herley: 115 tackles, 12 for loss
- B. Barlow: 9 interceptions
MaxPreps game reports cover 9 of its 9 games.
Historical program and playoff-series claims are withheld pending school-identity verification. Current-season reporting above is unaffected.
Keys to the game
- Can St. Mary's slow Lawrence-Nelson's offense? Lawrence-Nelson averaged 60.2 points; St. Mary's allowed 19.4. Lawrence-Nelson scored 30 or more in 8 of 8 games.
- St. Mary's's answer. It scored 35.1 a game, and Lawrence-Nelson's defense allowed 16.0. In its losses, though, St. Mary's averaged 15.0.
- Tested against playoff teams. Lawrence-Nelson went 3-0 against this year's playoff field; St. Mary's went 0-4.
- If it's close late. Lawrence-Nelson hasn't played a one-score game (8 points or fewer) this season. St. Mary's is 0-2 in them.
- W. Frey and the ball. Lawrence-Nelson's quarterback threw 5 interceptions in 72 reported attempts; St. Mary's's B. Barlow has 9 picks.
- Stopping W. Frey. Lawrence-Nelson's top rusher has 831 reported yards and 17 touchdowns. St. Mary's allowed 19.4 points a game.
What's next
The winner plays the winner of No. 8 Burwell vs. No. 9 Wynot in the quarterfinals Friday, Nov. 6. Higher seeds host through the semifinals. The Class D3 state final is Friday, Nov. 20 at 1 p.m. Central in Kearney. The stadium name remains unconfirmed because NSAA sources conflict; see the state finals schedule.
Game center: kickoff, live score and bracket path → · Full Class D3 bracket →
Verified state finals schedule → · Class bracket →
Lawrence-Nelson team center → · St. Mary's team center →
Nebraska football scores and schedules → · Football playoff tracker →
Result note: a 1–0 entry is shown as listed by NSAA. It is not treated as evidence of an on-field score or a confirmed forfeit.